So today I did something quite different. I used a light sensor to spy on the sun kinda.
I have always wondered at what exact time and at what rate the sun rises and sets. I have always been curious about this. So I decided to make a project to find out.
So I used a Photoresistor to measure the amount of light that was hitting the sensor. I then used a Raspberry Pi Zero W which I previously used for a previous project ( Making a retro bag! ) to record the data and plot it on a graph.
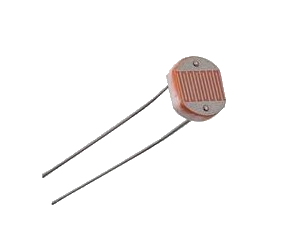
What’s a Photoresistor?
A photoresistor is a resistor that changes its resistance depending on the amount of light that is hitting it. The more light that hits it the lower the resistance. The less light that hits it the higher the resistance.
So How do we get the Raspberry Pi to read the resistance of the photoresistor?
There is an amazing Video by Flopperam that explains how to do this. I highly recommend you watch it. It is a great video.
So basically what we will be doing is calculating how long it would take to charge a capacitor to a certain voltage. The longer it takes to charge the capacitor the higher the resistance of the photoresistor. The shorter it takes to charge the capacitor the lower the resistance of the photoresistor. And with that, we can calculate how much light is hitting the photoresistor.
It is recommended that you use a 1uf 50v Capacitor for this but I have used a 2.2uf 50v Capacitor which was fine!
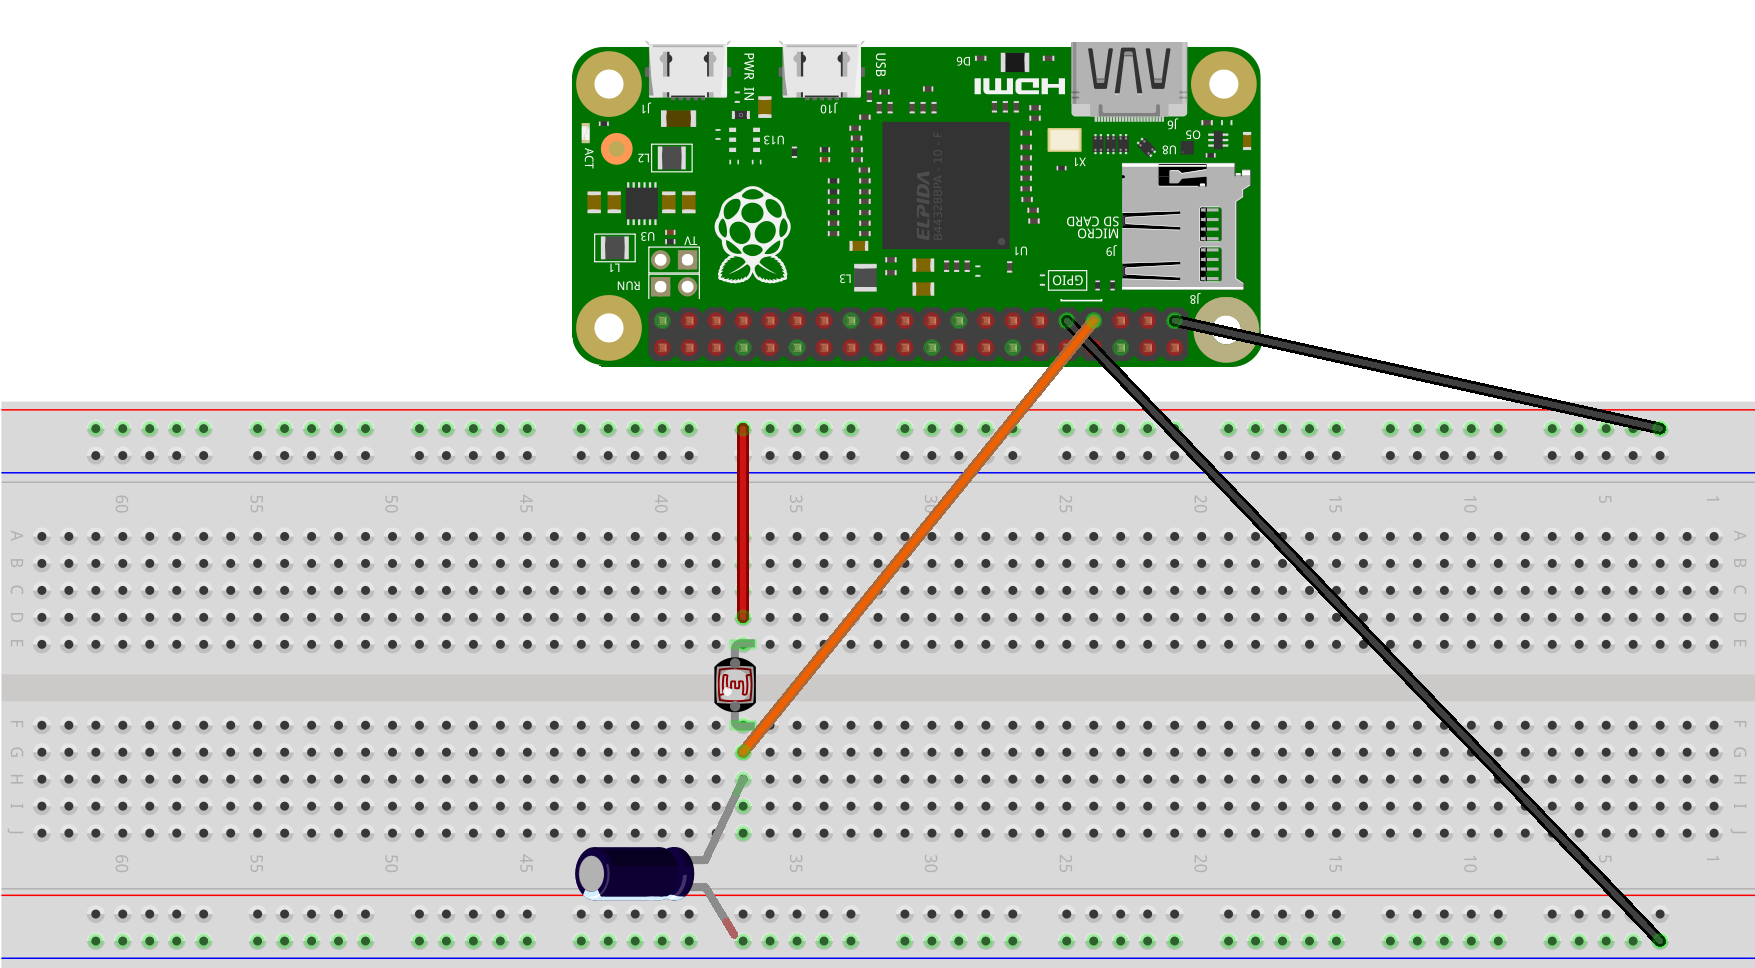
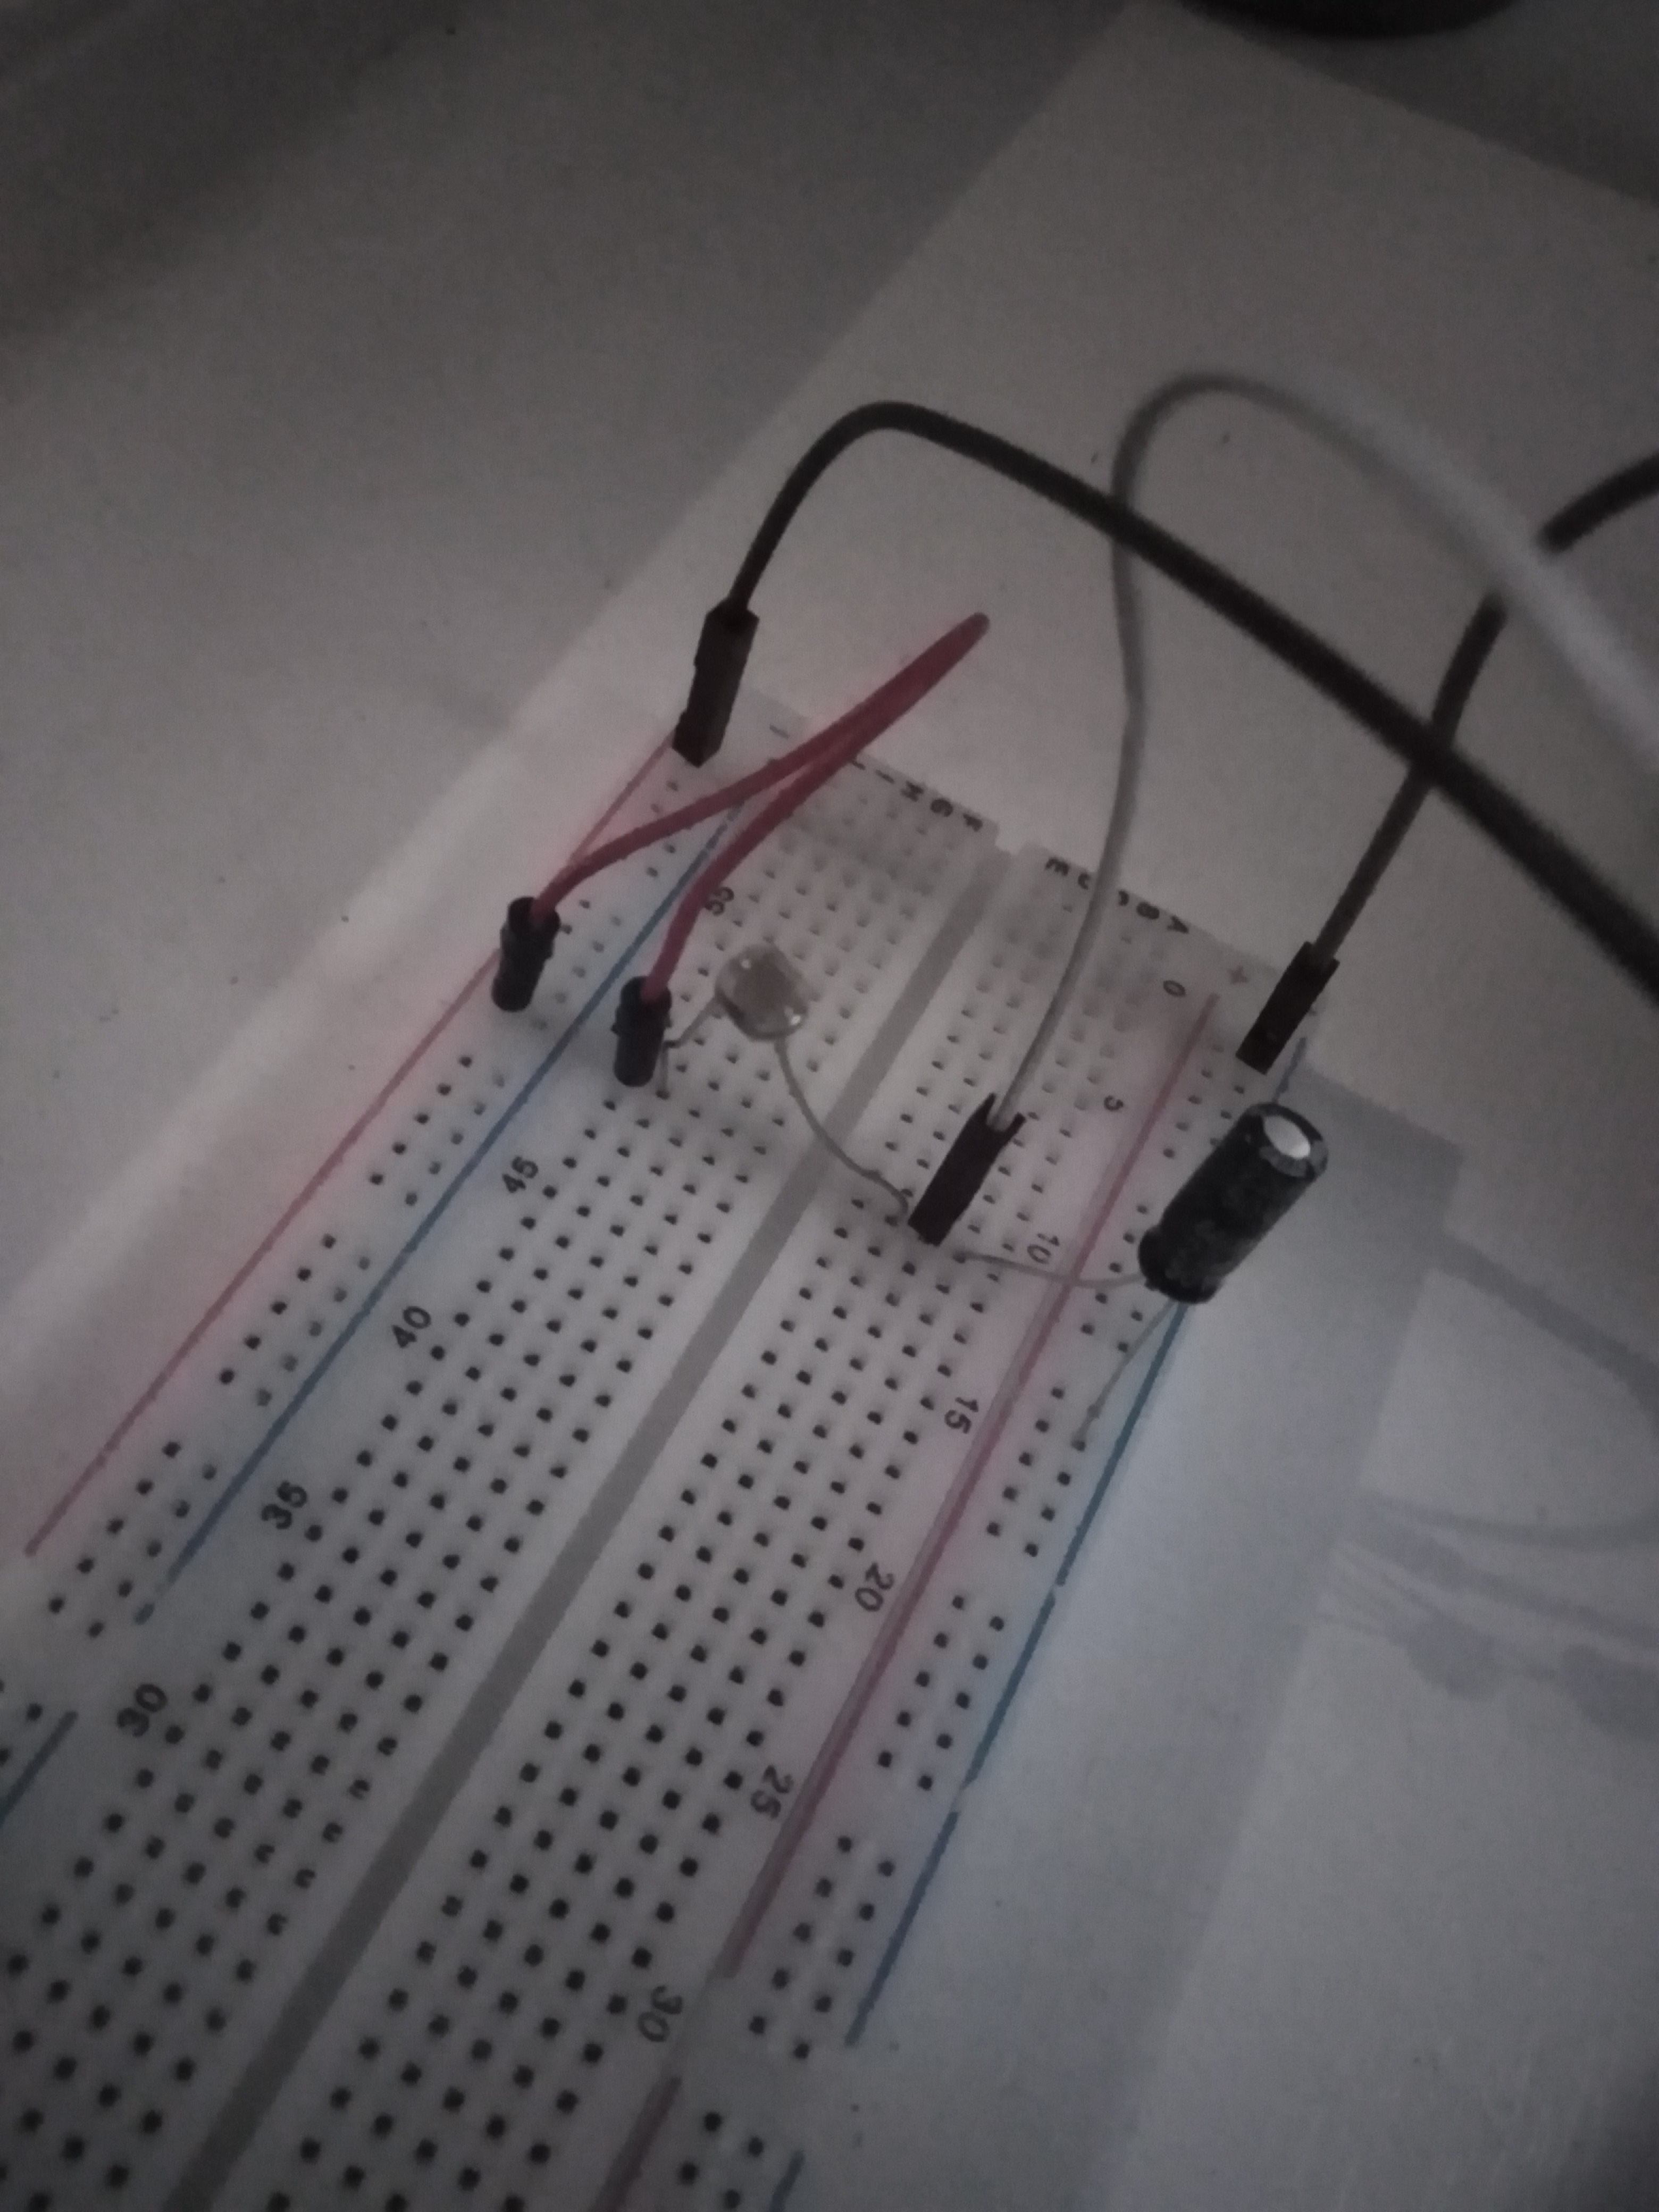
Now that we have connected our wires we have to write the code to read the data from the photoresistor.
First, we need to install the RPi.GPIO library. To do this we need to open up a terminal and type in the following command:
sudo apt-get install python3-rpi.gpio
Or you can use PIP to install the library.
sudo pip3 install RPi.GPIO
Now we need to create a python file. I named mine photoresistor.py. Now we need to import the RPi.GPIO library and time library.
import RPi.GPIO as GPIO
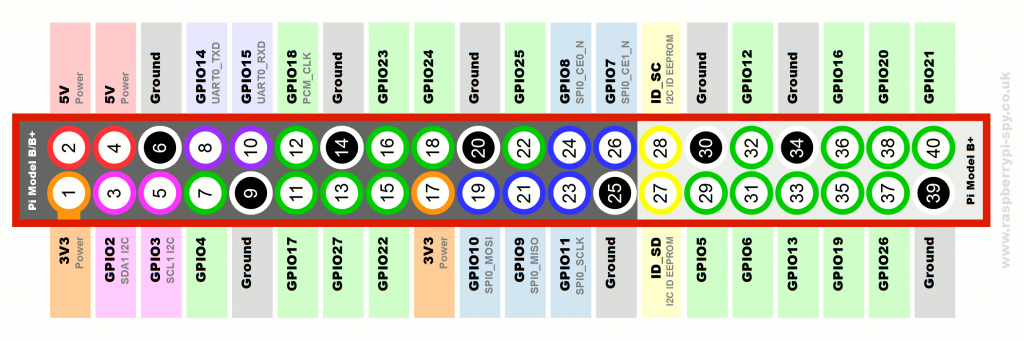
Also, we will need to set the mode of the GPIO pins to BOARD. The GPIO.BOARD option specifies that you are referring to the pins by the number of the pin on the plug - i.e the numbers printed on the board.
GPIO.setmode(GPIO.BOARD)
Now we need to set the pin that the photoresistor is connected to. I have used pin 7.
import RPi.GPIO as GPIO
import time

GPIO.setmode(GPIO.BOARD)

resistorPin = 7
So the finished code looks like this:
import RPi.GPIO as GPIO
import time

GPIO.setmode(GPIO.BOARD)

resistorPin = 7

while True:
    GPIO.setup(resistorPin, GPIO.OUT) # Set the resistorPin to output mode so we can charge the capacitor
    GPIO.output(resistorPin, GPIO.LOW) # Set the resistorPin to low so we can charge the capacitor
    time.sleep(0.1)

    GPIO.setup(resistorPin, GPIO.IN) # Set the resistorPin to input mode so we can read the voltage
    currentTime = time.time() # Get the current time
    diff = 0

    while(GPIO.input(resistorPin) == GPIO.LOW): # While the voltage is low keep looping until the voltage is high
        diff  = time.time() - currentTime # Get the difference between the current time and the time when the voltage was low

    print(diff * 1000) # Print the time it took to charge the capacitor in milliseconds(ms)
    time.sleep(1)
Now we can keep our values in a list along with a different list for the time:
import RPi.GPIO as GPIO

import time

GPIO.setmode(GPIO.BOARD)


resistorPin = 7

light_values = []
light_times = []
Now we can add the values to the list:
while True:
    GPIO.setup(resistorPin, GPIO.OUT)
    GPIO.output(resistorPin, GPIO.LOW)
    time.sleep(0.1)

    GPIO.setup(resistorPin, GPIO.IN)
    currentTime = time.time()
    diff = 0

    while(GPIO.input(resistorPin) == GPIO.LOW):
        diff  = time.time() - currentTime

    light_values.append(diff * 1000) # Add the time it took to charge the capacitor to the list
    light_times.append(time.strftime("%H:%M:%S")) # Add the current time to the list
    print(diff * 1000)
    time.sleep(1)
Now We can read the data from the photoresistor. But we need to plot the data on a graph. To do this we can install something called Flask.

What is Flask?
Flask is a micro web framework written in Python. It is classified as a microframework because it does not require particular tools or libraries. It has no database abstraction layer, form validation, or any other components where pre-existing third-party libraries provide common functions.
To install Flask we need to open up a terminal and type in the following command:
sudo pip3 install flask
Now we need to create a python file. I named mine flask.py. Now we need to import the Flask library.
from flask import Flask
Now we need to create a Flask app. I named my app.
from flask import Flask

app = Flask(__name__)
Now we need to create a route we can use the default route which is /.
from flask import Flask

app = Flask(__name__)

@app.route('/')
Now how can we display something on the route? We can use the return statement.
from flask import Flask

app = Flask(__name__)

@app.route('/')

def index():
    return "Hello World!"
And to run the app we need to use the run method.
from flask import Flask

app = Flask(__name__)

@app.route('/')

def index():
    return "Hello World!"

if __name__ == '__main__':
    app.run()
Now we can run the flask app. It would usually be on port 5000.
We can replace the Hello World with any HTML, Javascript, or CSS code we want.
Since we can now display things using Flask we can now display the data from the photoresistor on a graph.

For that, we can use a Library called Chart.js
What is Chart.js?
Chart.js is a free and open-source JavaScript library for data visualization that supports static and dynamic rendering. It is based on HTML5’s canvas element and is designed to be easy to use and to integrate with other JavaScript libraries.
To install Chart.js we can use them on our return statement.
<script src="https://cdn.jsdelivr.net/npm/chart.js"></script>
Now we need to create a canvas element. This is where the graph will be displayed.
<canvas id="myChart" width="400" height="400"></canvas>
Now we need to create a script element. This is where we will write the code to display the graph. We can use the light_times variable as the labels and the light_values variable as the data.
def index():
    HTML = """
    <script>
        const labels = """ + str(light_times) + """;
        const ctx = document.getElementById('myChart');

        new Chart(ctx, {
            type: 'line',
            data: {
            labels: labels,
            datasets: [{
                label: 'Light Values',
                data: """ + str(light_values) + """,
                fill: false,
                borderColor: 'rgb(75, 192, 192)',
                tension: 0.1
            }]
            },
            options: {
            scales: {
                y: {
                beginAtZero: true,
                }
            }
            }
        });
        </script>
    """
    return html
Now we should also reverse the graph so that the lowest value is at the top and the highest value is at the bottom. We can do this by using the reverse method.
def index():
    html = """
    <script>
        const labels = """ + str(light_times) + """;
        const ctx = document.getElementById('myChart');

        new Chart(ctx, {
            type: 'line',
            data: {
            labels: labels,
            datasets: [{
                label: 'Light Values',
                data: """ + str(light_values) + """,
                fill: false,
                borderColor: 'rgb(75, 192, 192)',
                tension: 0.1
            }]
            },
            options: {
            scales: {
                y: {
                    beginAtZero: true,
                    reverse: true
                }
            }
            }
        });
        </script>
    """
    return html
Now if we put all the code together we should get something like this:
from flask import Flask
import RPi.GPIO as GPIO
import time

GPIO.setmode(GPIO.BOARD)

resistorPin = 7

light_values = []
light_times = []

app = Flask(__name__)

@app.route('/')

def index():
    html = """
    <script src="https://cdn.jsdelivr.net/npm/chart.js"></script>
    <canvas id="myChart" width="400" height="400"></canvas>
    <script>
        const labels = """ + str(light_times) + """;
        const ctx = document.getElementById('myChart');

        new Chart(ctx, {
            type: 'line',
            data: {
            labels: labels,
            datasets: [{
                label: 'Light Values',
                data: """ + str(light_values) + """,
                fill: false,
                borderColor: 'rgb(75, 192, 192)',
                tension: 0.1
            }]
            },
            options: {
            scales: {
                y: {
                    beginAtZero: true,
                    reverse: true
                }
            }
            }
        });
        </script>
    """
    return html

if __name__ == '__main__':
    app.run()

    while True:
        GPIO.setup(resistorPin, GPIO.OUT)
        GPIO.output(resistorPin, GPIO.LOW)
        time.sleep(0.1)

        GPIO.setup(resistorPin, GPIO.IN)
        currentTime = time.time()
        diff = 0

        while(GPIO.input(resistorPin) == GPIO.LOW):
            diff  = time.time() - currentTime

        light_values.append(diff * 1000) # Add the time it took to charge the capacitor to the list
        light_times.append(time.strftime("%H:%M:%S")) # Add the current time to the list
        print(diff * 1000)
        time.sleep(1)
Now if you try to run this code you will not get any data. This is because the code is running the Flask app and the code reads the photoresistor at the same time. We need to run the Flask app in a different thread. We can do this by using the threading library.
What is threading?
Threading is a way to run multiple processes at the same time. This is useful when you want to run multiple tasks at the same time. For example, you can run a Flask app and a script to read data from a sensor at the same time.
from flask import Flask
import RPi.GPIO as GPIO
import time
import threading

GPIO.setmode(GPIO.BOARD)

resistorPin = 7

light_values = []
light_times = []

app = Flask(__name__)

@app.route('/')
def index():
    html = """
    <script src="https://cdn.jsdelivr.net/npm/chart.js"></script>
    <canvas id="myChart" width="400" height="400"></canvas>
    <script>
        const labels = """ + str(light_times) + """;
        const ctx = document.getElementById('myChart');

        new Chart(ctx, {
            type: 'line',
            data: {
            labels: labels,
            datasets: [{
                label: 'Light Values',
                data: """ + str(light_values) + """,
                fill: false,
                borderColor: 'rgb(75, 192, 192)',
                tension: 0.1
            }]
            },
            options: {
            scales: {
                y: {
                    beginAtZero: true,
                    reverse: true
                }
            }
            }
        });
        </script>
    """
    return html

def read_photoresistor():
    while True:
        GPIO.setup(resistorPin, GPIO.OUT)
        GPIO.output(resistorPin, GPIO.LOW)
        time.sleep(0.1)

        GPIO.setup(resistorPin, GPIO.IN)
        currentTime = time.time()
        diff = 0

        while(GPIO.input(resistorPin) == GPIO.LOW):
            diff  = time.time() - currentTime

        light_values.append(diff * 1000) # Add the time it took to charge the capacitor to the list
        light_times.append(time.strftime("%H:%M:%S")) # Add the current time to the list
        print(diff * 1000)
        time.sleep(1)

if __name__ == '__main__':
    thread = threading.Thread(target=read_photoresistor)
    thread.start()
    app.run()
Now I run the code this morning till the night to see how the light values change throughout the day it logged around 17250 light values!
This is what the graph looks like:
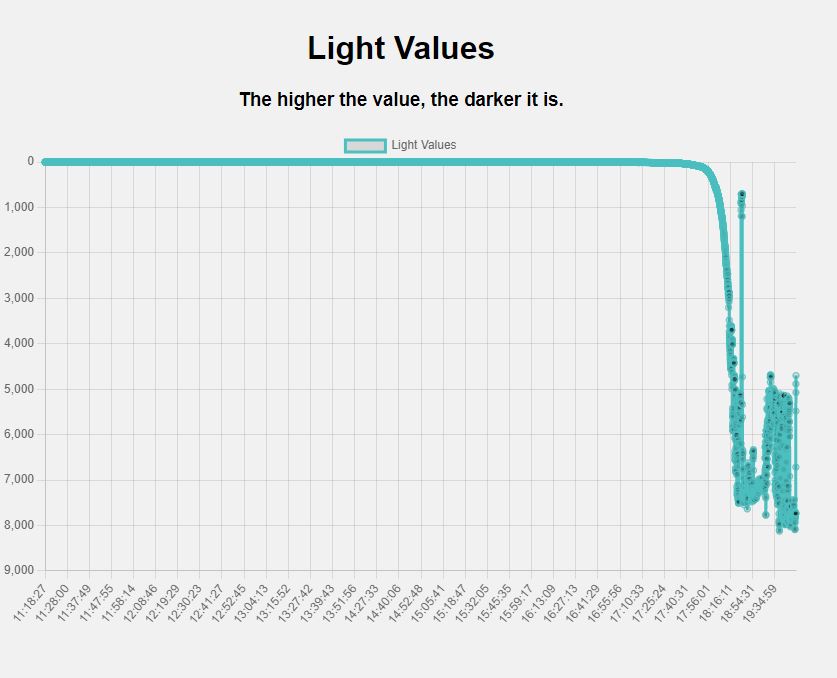
This shows me that the light changes from bright to dark in about 1 hour and 30 minutes. But I also noticed a bump in my graph around 19:00 and I realized that this is the time when the street lights turn on which was quite interesting.
This was quite an interesting project to work on and I got to work with Flask, Raspberry Pi, Python, Chart.js, Threading, and Electronics which was quite fun. I hope you enjoyed this project and thanks for reading :D